3340 Trickum Rd, Marietta, GA 30066 | Phone: 770-971-4711
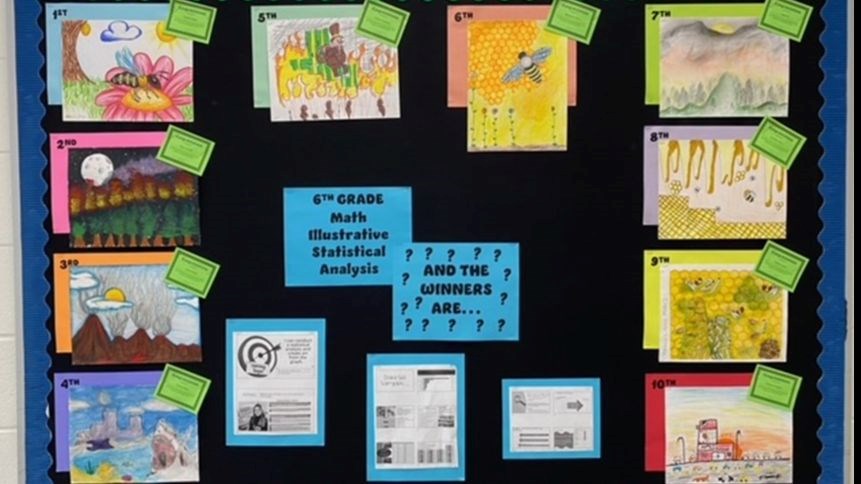
6th Grade Math Brings Color to Statistics
SHARE
6th grade Math students conducted a statistical analysis and created a piece of art from the graph of the data set of their choice. The illustrations reflected the topic of the data and used the shape of the graph as the structure of their design. Collaboration between the math, ELA, and art teachers made this project even more successful for the students! The most innovative designs were displayed and all 6th grade students had the opportunity to vote for their favorites. The bulletin board displayed our top 10 choices! It was a true STEAMy experience for us all!
Google Translate
Notes on Translation
The electronic translation service is hosted by Google Translate. The quality of the translation will vary in some of the languages offered by Google. Google Translate is a free service and currently offers translation in over 50 languages, although an impressive number, this does not capture all languages or dialects. The basic translation’s goal is to capture the general intention of the original English material.
The Cobb County School District does not guarantee the quality, accuracy or completeness of any translated information. Before you act on translated information, the District encourages you to confirm any facts that are important to you and affect any decisions you may make.
The Cobb County School District is committed to parent, family and community engagement, and it is our hope that by providing this tool on our website that we are making our information more accessible to families whose first language is not English and thereby enabling better engagement in public education.